
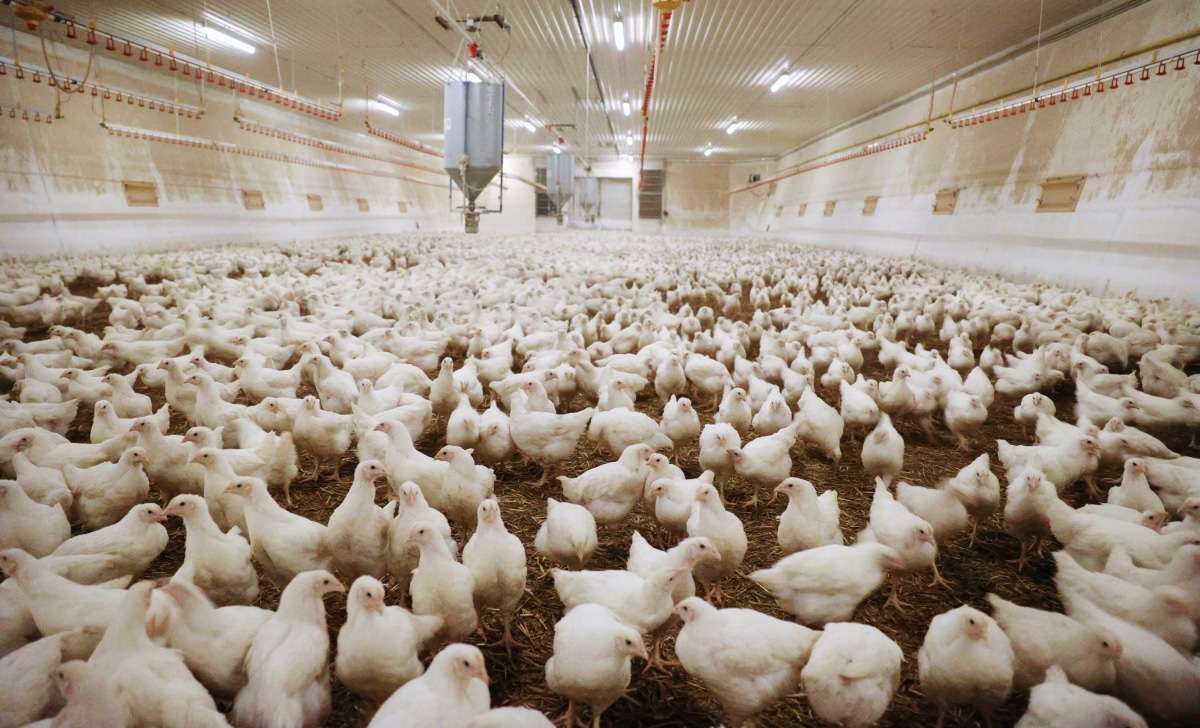
Flock uniformity describes how closely birds in the same flock match in body weight, most often measured with the coefficient of variation (CV) of body weight. Under standard commercial conditions between days 14 and 49, broiler flocks typically reach around 80 percent uniformity, with CV commonly ranging from 10 to 15 percent at market age (Choi et al., 2026). Producers who track this figure catch problems well before average weight or feed conversion shows a trend. Confirming it takes individual bird weights, not just a flock average, which is why routine weighing sits at the centre of managing uniformity.
How CV Measures Uniformity
CV is the standard deviation of individual bird weights divided by the mean weight, multiplied by 100; uniformity rate is 100 percent minus CV. A related benchmark is the share of birds within plus or minus 10 percent of the mean weight (Choi et al., 2026). A high CV also flags the birds at the extremes, worth a closer look since disease is a documented driver of reduced uniformity (Choi et al., 2026).
What Pulls a Flock Apart
Genetics sets a baseline that decades of selection have narrowed, though strain differences remain (Choi et al., 2026). Management pressures do more damage: straight-run (mixed-sex) rearing produces a less uniform flock than single-sex rearing, since males dominate feeder access, and nutrient-deficient diets, heat stress, and disease each cut uniformity by roughly 2.5 to 15 percent versus unchallenged flocks. Uneven ventilation and temperature distribution within the house add a further layer of variation, since birds in different parts of a shed are not always exposed to the same conditions (Choi et al., 2026).
Why It Affects the Bottom Line
Poor uniformity is costly beyond what an average weight figure shows. Feeding programmes are built around a specific bird weight and age, so a wide spread leaves part of the flock over- or under-fed, and automated lines downgrade birds outside target range, a direct hit to the link between flock uniformity and slaughter efficiency (Choi et al., 2026). Lighter, weaker birds also face more competition for feed and water, so uniformity doubles as a welfare indicator.
Tracking Uniformity With Routine Weighing
The BAT2 Connect automatic scale weighs birds continuously as they step on voluntarily, building a daily weight trend without added labour, often the first hint that variation is building.
Confirming that hint needs individual data, which averages cannot supply. The BAT1 manual poultry scale records each sampled bird’s weight, giving the standard deviation that CV and uniformity rate depend on, plus a hands-on look at fleshing and condition.
Turning Weighing Data Into Corrective Action
Continuous automatic tracking keeps the weight curve current between manual sampling points, so a shift in variation shows within days rather than at the next scheduled weighing.
Repeating a manual weighing round at the same points in the cycle turns one CV calculation into a trend showing whether a change actually narrowed the spread.
The BAT Cloud data platform brings readings from both methods together for any producer looking to improve flock uniformity.
Layer and breeder standards set the bar even higher, around 80 to 85 percent, and raising average weight alone does not fix a low score if the spread stays the same (Sibanda et al., 2020). For layer, breeder, and pullet flocks, and slow-growing broiler cycles long enough to allow it, sorting by weight is already standard practice for an uneven flock; the friction is the labour of doing it by hand. The BAT1 Sorting Machine attaches to the BAT1 scale to take a person out of that task. This does not apply to fast-growing broilers, where culling the lightest birds remains standard (Choi et al., 2026).
Average weight shows whether a flock hit its target; CV shows whether it did so as one flock or a scattered mix, a difference that shows at the feed bin and the processing line long before it shows in an average.
References
- Choi, J., Goo, D., Ko, H., Lee, J., & Kim, W. K. (2026). Factors affecting flock uniformity in broiler production: Individual, environmental, and management characteristics. Animals, 16(2), 185. https://www.mdpi.com/2076-2615/16/2/185
- Sibanda, T. Z., Kolakshyapati, M., Walkden-Brown, S. W., de Souza Vilela, J., Courtice, J. M., & Ruhnke, I. (2020). Body weight sub-populations are associated with significant different welfare, health and egg production status in Australian commercial free-range laying hens in an aviary system. European Poultry Science, 84, 1-18. https://www.sciencedirect.com/science/article/pii/S000390982500298X