Optimal growth can only be achieved in chickens when they are in a state of comfort. Therefore, the growth rates and body weight of chickens serve as sensitive indicators of discomfort in a flock, and accurate weighing can be used to identify problems. Accurate weighing of chickens more than once a week can provide rapid feedback about performance, environmental conditions, feed distribution, health, and welfare of the chickens. Furthermore, the weight of broiler chickens is used in the calculation of the feed conversion ratio, which is a crucial indicator of economic efficiency as feed accounts for 70% of all costs (Tandoğan & Çiçek, 2016).
In the traditional method, chickens are weighed using electronic manual poultry scales with 1 g accuracy, which provide accurate results. However, to achieve accurate information about the growth of the flock, several rules must be followed during the weighing process. Birds must be weighed at least once a week. However, at the end of fattening, weighing twice a week is a good choice to provide more accurate results. The number of weighed chickens required to obtain accurate results depends on the age of the chickens. From one to 21 days of age, chickens should be weighed as a bulk population. To do so, the chickens are caught using a catching frame and then placed into a vessel on a scale hanging above the catching frame. Samples should be collected in three locations throughout the house, away from the doors and walls. The weighing procedure should be standardized and repeatable, and the birds must be randomly selected.
A study conducted by Lingens et al. (2021) suggests that it is possible to identify the ideal number of birds to be weighed in order to get reliable data. In this study, the number of Ross 308 chickens housed in each group ranged from 3,318 to 3,582. From each group, 50 chicks were weighed at 0, 4, 7, 14, and 21 days of age using a BAT1 manual poultry scale. The sample size of the chickens represented approximately 1.4% to 1.5% of the total number of weighed birds, which was deemed sufficient to obtain reliable results for the average weight. As opposed to younger chickens, which can be weighed in groups, due their size, chickens older than 21 days of age must be weighed individually, making it more time-consuming In their study, Hughes and Wilkinson (2017) calculated the required sample size of chickens for an accurate prediction of the average flock live weight during the mixed-sex fattening of Cobb 500 chickens. Table 1 illustrates the requisite sample size for the 50,000-chicken flock, assuming a 10% uniformity rate. As the chickens age, the sample size must increase to ensure accurate results. The table depicts tolerances in grams, expressed as deviations from the flock’s calculated average weight. For instance, if the farmer is willing to accept a ±98-gram discrepancy from reality, a 1% sample of the flock is sufficient for 6-week-old chickens.
Table 1 Sample size required to reliably predict the average weight of a flock at various ages. (Hughes and Wilkinson, 2017)
| Weighed chickens
(% of flock) |
Tolerances from accurate average weight of the flock (g) | ||||
| 4 weeks | 5 weeks | 6 weeks | 7 weeks | 8 weeks | |
| 25 (0.05%) | 68g | 101g | 139g | 179g | 216g |
| 50 (0.1%) | 48g | 71g | 98g | 126g | 151g |
| 100 (0.2%) | 34g | 60g | 70g | 90g | 108g |
| 200 (0.4%) | 24g | 35g | 49g | 63g | 76g |
| 500 (1%) | 15g | 22g | 31g | 40g | 48g |
| 1000 (2%) | 11g | 16g | 22g | 28g | 34g |
| Mean weight (kg) | 1.615kg | 2.273kg | 2.952kg | 3.617kg | 4.227kg |
When manually weighing individual birds, it is crucial to pick up each bird in a calm and deliberate manner and place it in shackles to minimize its stress. Conversely, Zulkifli and Azah (2004) conducted an intriguing study on how handling impacts chicken performance. They divided the chickens into groups based on physical contact with humans and a control group. Chickens in the group subjected to unpleasant physical contact were suspended by both legs and swung gently for 30 seconds once daily in their home pen, which is comparable with the use of manual poultry scales. This treatment yielded no observable impact on body weight or mortality at the end of a 46-day fattening period. It can therefore be surmised from this study that intensive weighing practice more than once a week can be used to identify problems in a flock without detrimental effect on performance. Conversely, it is generally recommended that disturbing the flock be minimized to reduce stress. Manual poultry scales must be fast and easy to use to enable proper stress reduction in the flock, but at the same time must be accurate and suited for various poultry. BAT1 manual poultry scales have been utilized in numerous recent experimental trials on account of their ease of use and accuracy (Kolakshyapati et al., 2020; Sonnabend et al., 2022; Marggraf et al., 2024; Osborne et al., 2024). For example, Sibanda et al. (2020) utilized BAT1 scales to weigh approximately 14,000 laying hens during a single weighing event across various breeding systems with or without access to the free-range. These scales make it possible to rapidly collect reliable weight data from large numbers of birds whenever such a need arises.
Body weight uniformity
In order to determine flock uniformity, birds must be weighed individually. Uniformity is defined as the percentage of individuals within 10% of the mean body weight. The variability of uniformity can be expressed as the coefficient of variation (CV) of the individual body weights. Therefore, a higher CV of live body weights indicates poorer flock uniformity. A uniform flock is a significant benefit for farmers, as it enables them to make the most accurate decisions regarding feeding and environmental management should a flock’s development deviate from expected norms. Galosi et al. (2023) used BAT1 manual poultry scales to weigh samples from a total of 87,200 chickens. These scales are capable of calculating the mean body weight in real-time and record individual data to an internal memory, making it possible to later compare historical growth performances and uniformity of past productive cycles. Knowing the uniformity of a flock immediately after weighing helps farmers greatly by accelerating the decision-making process. The historical performance and uniformity data from previous fattening periods serve as a valuable instrument in identifying issues on farms. For example, De Jong and Van Riel (2020) found that causes of poor uniformity of carcass weight exhibited seasonal variations. Consequently, databases containing information about flock uniformity enable the current problems in uniformity to be compared with past problems to isolate various factors.
The live body weight uniformity of broiler flocks is a crucial parameter in the context of poultry production. Flocks with a uniform weight distribution offer several advantages in terms of management. Firstly, the chickens can be exposed to changes in management (lighting, feeding, and environment) in a more efficient manner. Secondly, the overall performance of the flock can be enhanced. Thirdly, the birds can achieve performance levels that approach their maximum genetic potential (Neto et al., 2013).
The emphasis on uniformity in broiler production has often been determined by the final step in the production line, the processing facility. For optimum product quality, uniform carcass size must meet the specifications of the equipment used in the processing facility. The quality of the management practices employed by the producer often affects the uniformity achieved in the flock (Griffin et al., 2005).
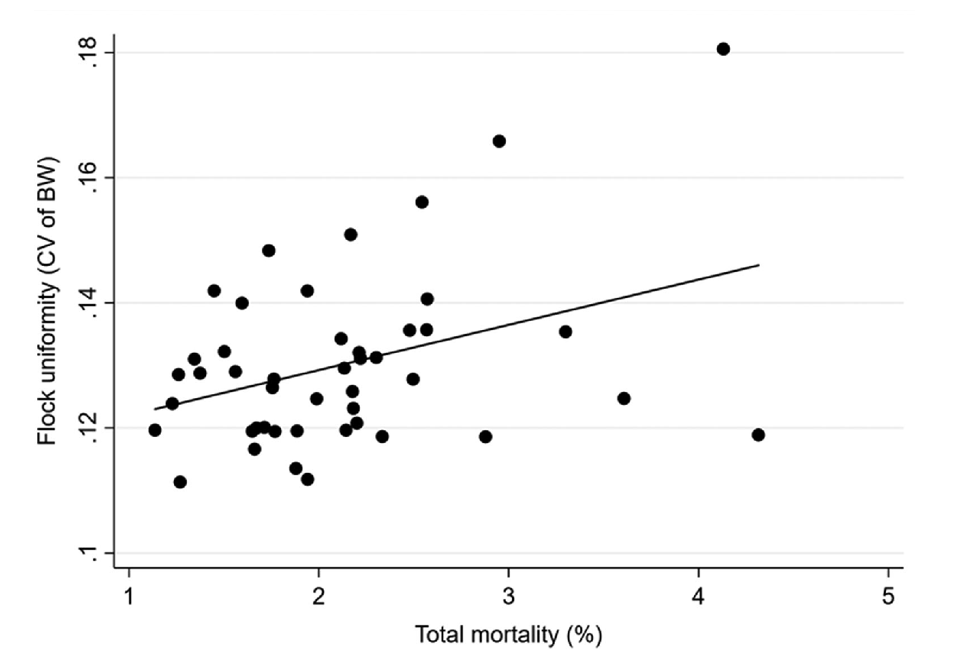
The importance of flock uniformity was clearly demonstrated by Vasdal et al. (2019). In their study, they associated data on carcass weight uniformity and important performance parameters for farmers in 45 flocks located on 45 different farms in Norway. A higher CV was found to be strongly linked to a poor feed conversion ratio (FCR) (Figure 1), increased total mortality (Figure 2), and reduced growth rate. From the graph, it can be readily observed that a 2% increase in the CV is associated with a 0.3-point decline in FCR. Such a result means chickens must consume an additional 0.3 kg of feed to increase their weight by the same 1 kg, which can severely impact productivity. Therefore, it can be concluded that uniformity is directly correlated with the profitability of the fattening process.
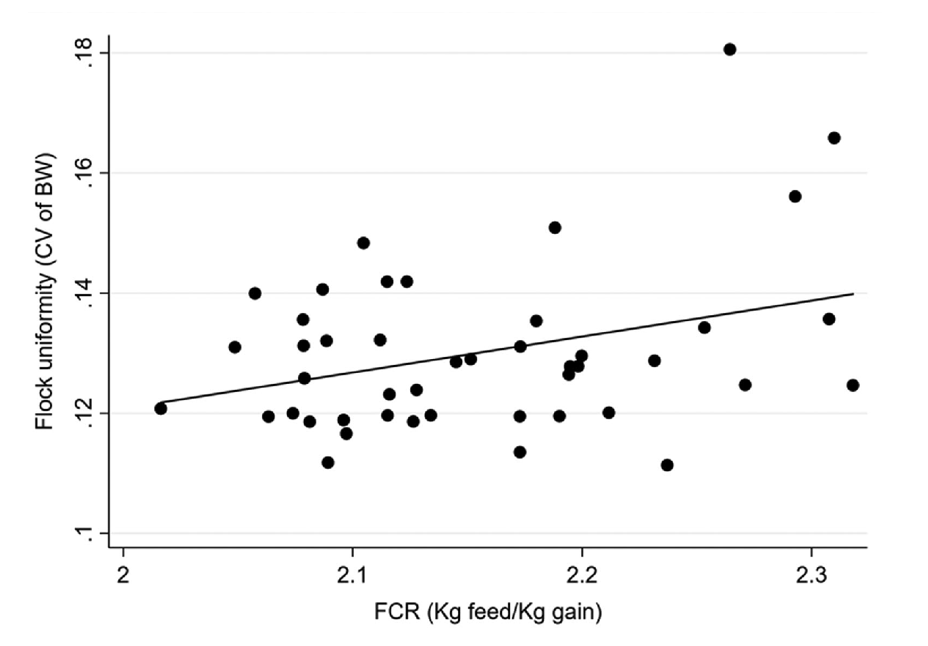
Figure 1. Associations between flock uniformity (CV of bodyweight in %) and FCR (feed conversion rate; kg feed/kg slaughter weight). (Vasdal et al., 2019)
If farmers can rapidly determine the uniformity of the flock and identify inappropriate results, they can examine the potential causes of the poor uniformity and implement corrective measures. The most common causes of poor uniformity during the fattening period are as follows:
- Occurrence of diseases in flock
- Discrepancies in environmental conditions (temperature, ventilation)
- Inappropriate feeding management
Occurrence of diseases in a flock
It is a well-established fact that bacterial diseases of the gastrointestinal tract have a negative impact on growth. Meta-analyses conducted by Remus et al. (2014) revealed that birds challenged by Clostridium spp., Escherichia coli, and Salmonella spp. exhibited a 40%, 11%, and 29% reduction in their growth rate, respectively. Consequently, a gradual decrease in the weight gain of the chickens is a reliable indicator of disease occurrence in the flock. Disease-related uniformity deterioration is typically manifested in the form of chickens with markedly low body weight, which contributes to increased weight variation within the flock. Consequently, an elevated CV can serve as a reliable indicator of disease occurrence within a flock. Prior to 10 days of age, a coefficient of variation exceeding 10% can be indicative of a problematic situation, potentially indicating the presence of disease in a flock with no overt clinical symptoms. Moreover, a recent study demonstrated a correlation between higher weight uniformity in laying hens and enhanced resilience against diseases. Consequently, high flock uniformity can serve as a foundation for effective health management in a flock (Berghof et al., 2019).
Environmental conditions
In the context of experimental conditions, it is of paramount importance to ensure that the same conditions prevail throughout the house. Discrepancies in temperature, particularly in the various sections of the house, can have a significant impact on chicken growth and disrupt flock uniformity. The negative effects of excessive temperatures are well documented. It is also important to note that lower temperatures can disrupt the growth of chickens as well, particularly in the first half of the fattening period. Chicks require higher temperatures during this period, and the use of infrared lamps can result in uneven temperatures throughout the house. Quintana-Ospina et al. (2023) conducted an interesting field study to evaluate the impact of exposing chickens to temperatures 5 °C below the optimal range on body weight. In it, they exposed 21-day-old Ross 308 chickens to temperatures 5 °C lower than optimal and observed a resulting decrease in body weight of 50 g. Therefore, it is important to note that all deviations in temperature, whether higher or lower,, must be considered when assessing flock development. Typically, areas of houses with lower temperatures are a result of drafty conditions caused by inappropriate ventilation settings. Such disparate conditions can easily lead to disruptions in flock uniformity (Shlosberg et al., 1992).
Feeding management
Chickens exhibit individual preconditions for growth, which can result in differences in their weight throughout their lives. The primary objective of feeding and drinking management is to provide all chickens with equal access, thereby mitigating individual differences in preconditioned growth. To achieve optimal uniformity, it is essential to provide as much feeding space as possible, ideally filling the feeders during periods of rest (darkness) and to control uniformity of the feed structure. In the case of pelleted diets, the nutrient composition should be identical to that of the feed mixture. A comparison of chickens fed a pelleted diet with those fed a mash diet revealed that a pelleted diet led to 5% better uniformity (Sena et al., 2013). The breaking strength of the pellets can vary, and those with insufficient breaking strength can be ground down during transport and handling. McCoy et al. (1994) evaluated appropriate and inappropriate mixed feed mixtures and their effect on flock uniformity. In the study, the resulting differences in live body weights among chickens fed a poorly mixed diet was 13% (116 g), while those fed an adequately mixed diet showed a difference of only 2.5% (57 g). Inadequate feed distribution within the house is a frequent cause of uniformity fluctuations.
Sorting chickens by weight or sex to achieve optimal growth and uniformity
Some research indicates that it may be advantageous to categorize chickens based on their weight to enhance productivity. Neto et al. (2013) divided the day-old chicks into three groups based on their weight and compared flock uniformity with a group with a random weight distribution. The weight distribution comparison between the groups with homogenous weights and random groups at 42 days is presented in Graph 3.
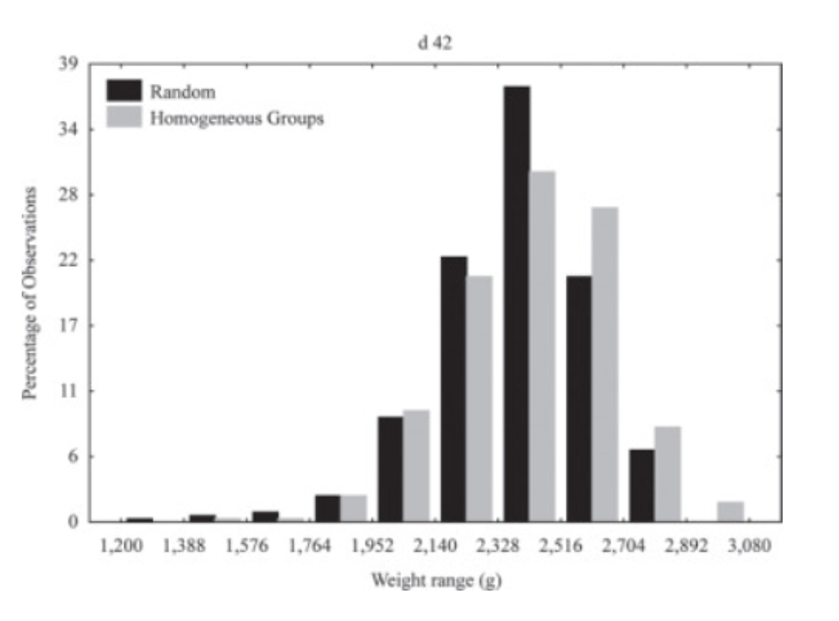
The grouping of day-old chickens in the study by Neto et al. (2013) did not result in improved flock uniformity. This is likely due to the inadequate diets provided to the groups, as they were fed the same diets independently of their weight. Limiting the amino acids added to the diet can significantly enhance weight uniformity. The chickens with different growth potential have different dietary amino acid requirements (Niknafs et al., 2022). Gous (2003) demonstrated that the coefficient of variation in live weight at 42 days was reduced by 40% and breast meat yield by 47% by supplementing basal feed with 0.8 g/kg of DL-Methionine. Moreover, lysine supplementation plays a pivotal role in achieving growth potential, particularly when males and females have been separated for fattening. Research has shown that males and females require different amounts of lysine to achieve their optimal growth potential (Gous, 2003). Therefore, it is necessary to formulate a diet that meets the specific requirements of each sex. A compromise can be made between the lysine requirements of males and females by feeding them the same protein content during each phase of growth. However, this may result in male broilers being underfed amino acids for longer periods than females (Gous, 2018). A current study calculated the economic value of lysine addition to the diet in male and female chickens. Dennehy et al. (2023) identified optimal values of lysine added to the diet for females at 0.752-1.292% and 0.748 to 1.320% for males. The most profitable value appears to be 1.10%, at which point the authors calculated that gross profit from 1 million birds was $4,874 based on lysine addition. It can be concluded from these studies that if the management associated with separating the chickens based on their weight or sex is supposed to be profitable, it is essential to apply optimal nutrition with an emphasis on amino acid levels.
The control of the weight and uniformity of a flock provides valuable information about the conditions in the house. Firstly, it is highly beneficial to have fast access to data from flock-based weighing using manual poultry scales, which are the gold standard for measuring chicken performance. Secondly, modern poultry weighing scales can provide a great deal of information about the current situation on the farm. However, it is therefore important that farmers have the theoretical and practical background to get the most out of this information in order to achieve high productivity.
Cited sources
Berghof, T. V., Bovenhuis, H., & Mulder, H. A. (2019). Body weight deviations as indicator for resilience in layer chickens. Frontiers in genetics, 10, 1216.
de Jong, I. C., & van Riel, J. W. (2020). Relative contribution of production chain phases to health and performance of broiler chickens: a field study. Poultry science, 99(1), 179-188.
Dennehy, D. G., Brown, A. T., Coto, C., Mejia, L., & Wamsley, K. G. S. (2023). Determining the digestible lysine requirement of Cobb MV× Cobb 500 FF broilers from 28-41 days of age and the effect of feeding varying digestible lysine levels on performance, processing, and economics. Journal of Applied Poultry Research, 32(1), 100326.
Galosi, L., Falconi, R., Biagini, L., Corrales Barrios, Y., & Roncarati, A. (2023). LED Light Applied to the Feeder: Impact on Growth Performances of Chickens under Productive Conditions. Veterinary Sciences, 10(4), 306.
Gous, R. M. (2018). Nutritional and environmental effects on broiler uniformity. World’s Poultry Science Journal, 74(1), 21-34.
Griffin, A. M., Renema, R. A., Robinson, F. E., & Zuidhof, M. J. (2005). The influence of rearing light period and the use of broiler or broiler breeder diets on forty-two-day body weight, fleshing, and flock uniformity in broiler stocks. Journal of applied poultry research, 14(2), 204-216.
Hughes R.J. and S.J. Wilkinson (2019) Flock Uniformity and Sample Size Requirements for Accurate Prediction of Live Weight During Mixed-Sex Rearing of Chickens. 30th Annual Australian Poultry Science Symposium 2019.
Kolakshyapati, M., Taylor, P. S., Hamlin, A., Sibanda, T. Z., Vilela, J. D. S., & Ruhnke, I. (2020). Frequent visits to an outdoor range and lower areas of an aviary system is related to curiosity in commercial free-range laying hens. Animals, 10(9), 1706.
Lingens, J. B., Abd El-Wahab, A., Ahmed, M. F. E., Schubert, D. C., Sürie, C., & Visscher, C. (2021). Effects of Early Nutrition of Hatched Chicks on Welfare and Growth Performance: A Pilot Study. Animals : an open access journal from MDPI, 11(10), 2888. https://doi.org/10.3390/ani11102888
Marggraff, J., Gernand, E., Ahlers, C., Huchler, M., Rautenschlein, S., & Donat, K. (2024). Factors associated with keel bone damage–a longitudinal study of commercial layer flocks during the laying period. British Poultry Science, 1-9.
McCoy, R. A., Behnke, K. C., Hancock, J. D., & McEllhiney, R. R. (1994). Effect of mixing uniformity on broiler chick performance. Poultry Science, 73(3), 443-451.
Neto, R. M., Surek, D., da Rocha, C., Dahlke, F., & Maiorka, A. (2013). The effect of grouping one-day-old chicks by body weight on the uniformity of broilers. Journal of Applied Poultry Research, 22(2), 245-250.
Niknafs, S., Fortes, M. R., Cho, S., Black, J. L., & Roura, E. (2022). Alanine-specific appetite in slow growing chickens is associated with impaired glucose transport and TCA cycle. BMC genomics, 23(1), 393.
Osborne, R. C., Harris, C. E., Buhr, R. J., & Kiepper, B. H. (2024). Impact of stunning method on blood loss in broilers during exsanguination with 2 different neck cut methods. Journal of Applied Poultry Research, 33(1), 100385.
Quintana-Ospina, G. A., Alfaro-Wisaquillo, M. C., Oviedo-Rondon, E. O., Ruiz-Ramirez, J. R., Bernal-Arango, L. C., & Martinez-Bernal, G. D. (2023). Effect of Environmental and Farm-Associated Factors on Live Performance Parameters of Broilers Raised under Commercial Tropical Conditions. Animals, 13(21), 3312.
Remus, A., Hauschild, L., Andretta, I., Kipper, M., Lehnen, C. R., & Sakomura, N. K. (2014). A meta-analysis of the feed intake and growth performance of broiler chickens challenged by bacteria. Poultry science, 93(5), 1149–1158. https://doi.org/10.3382/ps.2013-03540
Sena, L., Peti, D., & Nikolova, N. (2013). The effect of physical feed structure on the commercial broilers‘ performance.
Shlosberg, A., Zadikov, I., Bendheim, U., Handji, V., & Berman, E. (1992). The effects of poor ventilation, low temperatures, type of feed and sex of bird on the development of ascites in broilers. physiopathological factors. Avian pathology : journal of the W.V.P.A, 21(3), 369–382. https://doi.org/10.1080/03079459208418855
Sibanda, T. Z., Walkden-Brown, S. W., Kolakshyapati, M., Dawson, B., Schneider, D., Welch, M., … & Ruhnke, I. (2020). Flock use of the range is associated with the use of different components of a multi-tier aviary system in commercial free-range laying hens. British Poultry Science, 61(2), 97-106.
Sonnabend, S. J., Spieß, F., Reckels, B., Ahmed, M. F., El-Wahab, A. A., Sürie, C., … & Visscher, C. (2022). Influence of using perforated plastic flooring beneath the waterline on growth performance, litter quality, and footpad health of broiler chickens: a field study. Animals, 12(14), 1749.
Tandoğan, M., & Çiçek, H. (2016). Technical performance and cost analysis of broiler production in Turkey. Brazilian Journal of Poultry Science, 18, 169-174.
Vasdal, G., Granquist, E. G., Skjerve, E., de Jong, I. C., Berg, C., Michel, V., & Moe, R. O. (2019). Associations between carcass weight uniformity and production measures on farm and at slaughter in commercial broiler flocks. Poultry science, 98(10), 4261–4268. https://doi.org/10.3382/ps/pez252
Zulkifli, I., & Azah, A. S. N. (2004). Fear and stress reactions, and the performance of commercial broiler chickens subjected to regular pleasant and unpleasant contacts with human being. Applied Animal Behaviour Science, 88(1-2), 77-87.