Dlaczego tempo wzrostu kurcząt decyduje o sukcesie budżetu paszowego
Pasza stanowi 70% wszystkich kosztów produkcji w operacjach wzrostu brojlerów (Tandoğan & Çiçek, 2016). Każdy gram wydajności przyrostu masy ciała ma bezpośredni wpływ na rentowność. Badania pokazują, że 2% wzrost współczynnika zmienności (CV) prowadzi do 0,3-punktowego spadku współczynnika konwersji paszy (FCR) (Vasdal i in., 2019). Oznacza to, że ptaki muszą spożyć dodatkowe 0,3 kg paszy, aby uzyskać ten sam 1 kg przyrostu masy.
Różnica między opłacalną a zmagającą się z problemami produkcją często sprowadza się do tego, jak precyzyjnie monitoruje się wzorce wzrostu kurcząt i jak szybko reaguje się na odchylenia. Profesjonalni producenci stosujący systematyczne protokoły ważenia konsekwentnie osiągają lepszą jednorodność i niższe współczynniki konwersji paszy.
Jakie są pasze dla brojlerów na różnych etapach wzrostu: Ekonomia właściwego czasu
Zrozumienie efektywności wykorzystania paszy (FCR) wymaga śledzenia wydajności na każdym etapie wzrostu. Według Lukića i in., następujące podejście przynosi najlepsze rezultaty:
Faza początkowa (0-7 dni): Docelowy FCR na poziomie 1,05-1,14 kg paszy na kg przyrostu. Wczesna precyzja w tej fazie stanowi podstawę dla całego cyklu produkcyjnego.
Przedłużony starter (0–21 dni): Celem jest FCR w zakresie 1,32–1,38. Odchylenia na tym etapie potęgują się w dalszym przebiegu wzrostu.
Faza wzrostu (22–35 dni): Typowy FCR wynosi 1,68–1,75. W tym okresie brojlery silnie reagują na zmiany w zarządzaniu.
Faza końcowa (36–42 dni): Ostateczny docelowy FCR to 1,72–1,76 i to on decyduje o całkowitej opłacalności produkcji. Późne korekty są coraz droższe i mniej efektywne.
Precyzyjny czas zmiany paszy w oparciu o rzeczywiste dane dotyczące wagi, a nie daty kalendarzowe, może poprawić ogólny FCR o 3-5%.
Czynnik jednorodności
Jednolitość stada ma bezpośredni związek z rentownością. Badania pokazują wyraźne zależności między wskaźnikami jednolitości a wynikami ekonomicznymi:
– Docelowy współczynnik zmienności (CV): CV na poziomie 8% lub niższym oznacza doskonałą jednolitość. CV powyżej 10% wskazuje na słabą jednolitość i wymaga natychmiastowej interwencji zarządczej.
– Procent jednorodności: W standardowych warunkach hodowlanych należy dążyć do jednolitości na poziomie 70–72%. Dobrze zarządzane stada mogą osiągać nawet 80% jednolitości w momencie fotostymulacji.
– Zastosowania odchylenia standardowego: Ten często pomijany wskaźnik pomaga oszacować rozkład wagowy ptaków w stadzie, co wspiera planowanie uboju i decyzje związane z wejściem na rynek.
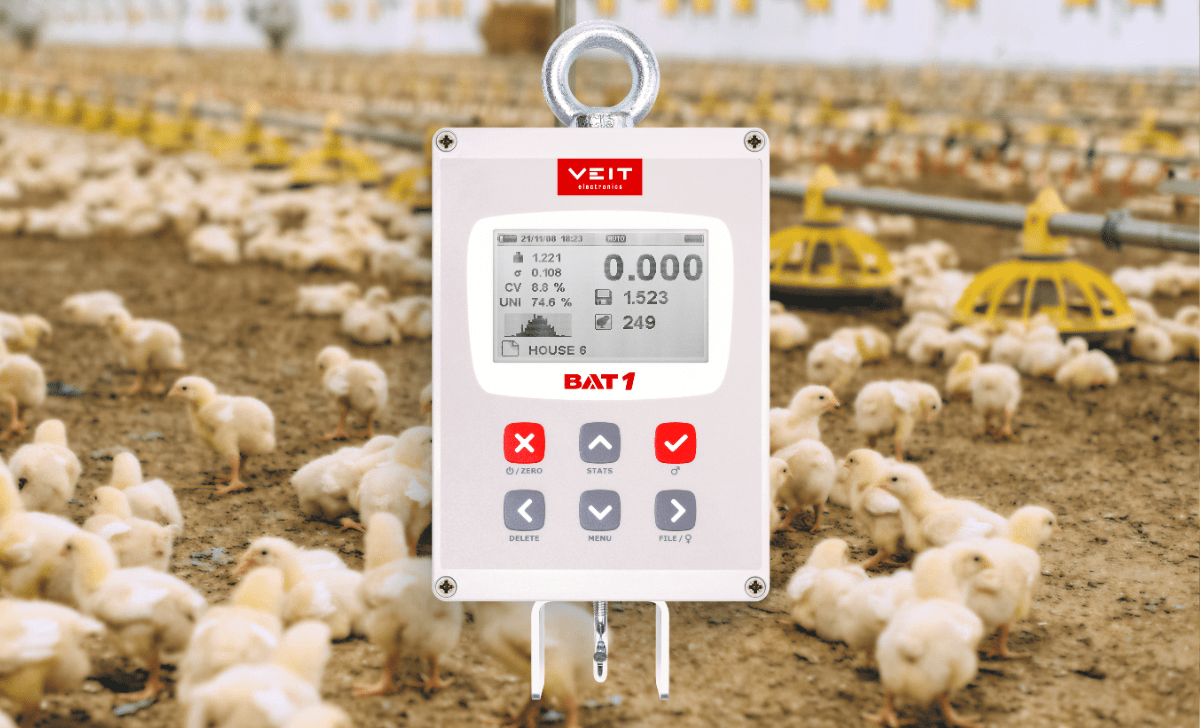
Ręczna waga do drobiu BAT1 automatycznie oblicza te krytyczne statystyki, eliminując błędy obliczeniowe i zapewniając natychmiastową informację zwrotną dla decyzji zarządczych.
Protokoły pobierania próbek dostarczające wiarygodnych danych z wykresów wzrostu kurcząt brojlerów
Dokładne monitorowanie wzrostu wymaga systematycznego pobierania próbek potwierdzonego badaniami:
– Wielkość próby: Należy ważyć co najmniej 1–2% całej populacji lub 50–100 ptaków, w zależności od tego, która liczba jest większa (Hughes & Wilkinson, 2017). Większe stada wymagają proporcjonalnie większych próbek dla zapewnienia dokładności statystycznej.
– Protokoły zależne od wieku: Ptaki w wieku 0–21 dni można ważyć grupowo przy użyciu ramki chwytającej. Powyżej 21. dnia życia dla uzyskania dokładnych danych konieczne jest ważenie indywidualne (Lingens i in., 2021).
– Strategia lokalizacji: Próbki należy pobierać z trzech stref kurnika — z przodu, ze środka i z tyłu — unikając obszarów w pobliżu karmników, gdzie ptaki zazwyczaj są cięższe od średniej (Cobb Breeder Management Guide).
– Standardy częstotliwości: Cotygodniowe ważenie pozwala na podstawowe monitorowanie wzrostu. W ostatnich fazach tuczu zaleca się ważenie dwa razy w tygodniu, co umożliwia precyzyjne podejmowanie decyzji dotyczących terminu uboju.
Badania przeprowadzone z wykorzystaniem wag BAT1 wykazały, że próba obejmująca 1,4–1,5% stada zapewnia wystarczającą dokładność do określenia wiarygodnej średniej masy ciała w warunkach produkcji komercyjnej.
Integracja technologii w celu optymalizacji wag do ważenia drobiu
Nowoczesne systemy wag do ważenia drobiu przekształcają surowe dane w praktyczne informacje wspierające zarządzanie:
– Automatyczne obliczenia: Profesjonalne wagi automatycznie obliczają średnią masę ciała, procentową jednolitość stada, współczynnik zmienności (CV) oraz odchylenie standardowe, eliminując błędy ludzkie.
– Pojemność pamięci: Systemy przechowujące tysiące indywidualnych wyników ważenia z różnych grup umożliwiają analizę trendów i porównania wydajności.
– Integracja z oprogramowaniem: Bezpośredni transfer danych do systemów zarządzania gospodarstwem eliminuje błędy wynikające z przepisywania i pozwala na natychmiastową analizę.
– Monitorowanie w czasie rzeczywistym: Natychmiastowy dostęp do statystyk wzrostu umożliwia szybką reakcję na pojawiające się odchylenia.
Wewnętrzna pamięć BAT1 i automatyczne znaczniki czasu eliminują możliwość fałszowania danych, zapewniając jednocześnie pełną dokumentację do analizy.
Przekształcanie danych dotyczących wzrostu kurcząt w przyrost wydajności paszy
Profesjonalni hodowcy osiągają lepsze wyniki dzięki systematycznej analizie danych wagowych:
– Monitorowanie FCR: Śledzenie współczynnika wykorzystania paszy na poszczególnych etapach wzrostu. Wczesne wykrycie problemów z efektywnością pozwala na podjęcie działań korygujących zanim wystąpią poważne straty ekonomiczne.
– Analiza tempa wzrostu: Cotygodniowa kontrola przyrostów masy względem standardów rasy. Odchylenia przekraczające 5% wymagają sprawdzenia jakości paszy, sposobu jej podawania lub warunków środowiskowych.
– Śledzenie jednolitości: Niska jednolitość wskazuje na problemy w zarządzaniu, które wymagają natychmiastowej reakcji. Regularne monitorowanie umożliwia działanie z wyprzedzeniem, a nie dopiero po wystąpieniu problemów.
Porównania historyczne: Dane archiwalne pozwalają zidentyfikować wzorce sezonowe i poprawiać wyniki z roku na rok.
Wpływ ważenia precyzyjnego na gospodarkę
Inwestycja w profesjonalny sprzęt do ważenia przynosi wymierne korzyści:
– Poprawa efektywności wykorzystania paszy: Systematyczny monitoring zwykle przynosi 3–8% poprawę współczynnika konwersji paszy.
– Optymalizacja uboju: Dokładne przewidywanie masy umożliwia optymalny dobór terminu uboju, maksymalizując wartość tuszy.
– Zmniejszenie zmienności: Lepsza jednolitość stada redukuje obniżki jakości przy uboju i zwiększa wartość produktów.
– Efektywność pracy: Uproszczone zbieranie danych i automatyczne obliczenia zmniejszają nakład pracy przy jednoczesnym zwiększeniu dokładności.
Strategia wdrażania optymalizacji wzrostu brojlerów
Rozpocznij wdrażanie precyzyjnych protokołów ważenia od zaraz:
– Wybór sprzętu: Wybierz wagi o dokładności do 1 grama i z funkcją automatycznego zapisu danych. BAT1 zapewnia profesjonalną precyzję oraz łatwą obsługę.
– Opracowanie protokołów: Ustal spójne procedury pobierania próbek, terminy oraz lokalizacje ważenia. Przeszkol personel w zakresie prawidłowych technik i kalibracji sprzętu.
– Zarządzanie danymi: Wdróż systemy do przechowywania, analizy i monitorowania trendów. Zintegruj dane z ważenia z innymi wskaźnikami produkcyjnymi.
– Monitorowanie wyników: Ustal podstawowe wskaźniki wydajności i śledź postępy w czasie.
Gotowy, by przekształcić monitoring wzrostu kurcząt w optymalizację zysków? Profesjonalny sprzęt do ważenia zwraca się poprzez poprawę efektywności paszy i ograniczenie strat.
Dowiedz się, jak BAT1 może zoptymalizować zarządzanie krzywą wzrostu.
Cytowane źródła
- Cobb Breeder Management Guide. Page 75-79. Weight calculation and uniformity analysis protocols.
- Lingens, J.B., et al. (2021). Sample size optimization for reliable broiler growth monitoring using BAT1 manual poultry scales. Research study on Ross 308 chickens, groups 3,318-3,582 birds.
- Tandoğan, M., & Çiçek, H. (2016). Economic impact of feed conversion efficiency in commercial broiler production. Feed costs representing 70% of total production expenses.
- Vasdal, G., et al. (2019). Relationship between flock uniformity and feed conversion ratio. Research demonstrating 2% CV increase correlates with 0.3-point FCR decline.
- Lukić, M., et al. (2022). How does the choice of genotype and feed in the local market affect broiler performance and farm economy? Agriculture Journal, 12, 843.