Every poultry farmer knows the frustration of seeing unexpected livestock weight fluctuations in their flock data. One day your birds are on target, the next they’ve dropped 50 grams. Understanding these variations is critical for protecting both flock health and your bottom line.
What Weight Variations Really Mean
Poultry weight variations often serve as your flock’s early warning system. Temperature stands as the most significant environmental factor affecting growth performance indicators. When birds experience suboptimal conditions, they redirect energy from growth to maintaining vital functions. This appears in your data as sudden drops or plateaus in analyzing animal weight gain patterns.
Research confirms that daily weight fluctuations reaching 8% can occur when litter moisture exceeds optimal levels (De Jong et al., 2014). Additionally, disease challenges like coccidiosis can reduce growth rates by 10.5% and daily gains by 39 grams (Freitas et al., 2023).
Key Metrics for Farm Weight Data Analysis
The coefficient of variation (CV) is your most powerful tool for interpreting animal weight data. A low CV indicates uniform flocks, while high values signal management issues (Cobb Breeder Management Guide, 2024). Professional farmers maintain CV values below 8% for optimal production.
Understanding poultry weight fluctuations requires tracking multiple indicators simultaneously. Seven-day weights prove particularly valuable, as week-old body weight serves as the most accurate predictor of final performance (Tona et al., 2004). Birds should achieve 4.84 times their hatch weight by day seven (VAL-CO, 2021).
The Technology Advantage
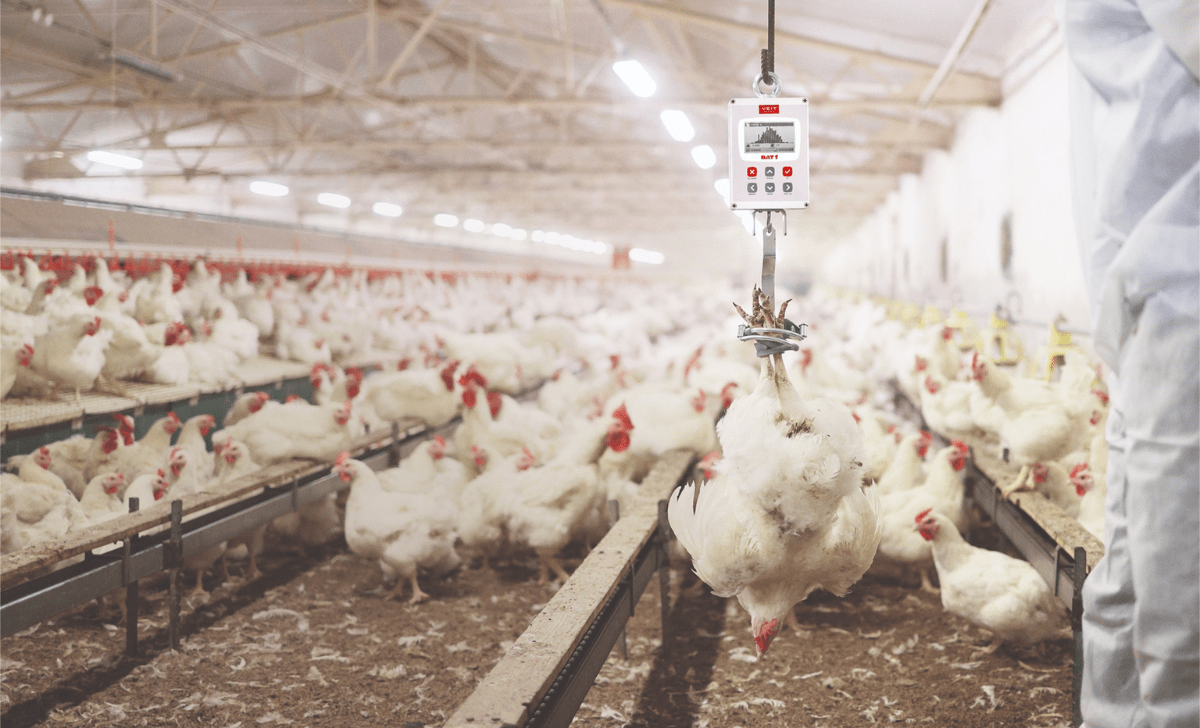
Modern livestock weight monitoring has transformed from weekly manual sampling to include continuous automated tracking. Traditional methods capture data for an extremely small amount of a bird’s life and may miss detrimental fluctuations till it’s too late. Technologies like the BAT2 Connect automatic poultry scale provide 24/7 weight monitoring with real-time alerts when deviations occur.
For farms using manual weighing, specialized poultry scales like the BAT1 eliminate human error while automatically calculating essential statistics including CV, uniformity, and average weight. This data can sync seamlessly to BAT Cloud for remote monitoring.
Livestock Weight Monitoring Best Practices
Implement these feed conversion tracking strategies:
Weigh consistently. Sample at least 2% of the flock from multiple house locations weekly.
Calculate CV weekly. Values above 10% demand immediate investigation into feed distribution, water access, or environmental controls (Broiler Management Guide, 2021).
Track early indicators. Monitor day-seven and day-fourteen weights religiously. Poor early performance compounds throughout the growth cycle (ProAgri Media, 2024).
Investigate sudden changes. Weight drops warrant checking temperature logs, feed quality, and disease indicators before problems escalate.
Use reliable equipment. Inaccurate poultry scale data leads to poor decisions. Professional scales designed for live birds provide accuracy that generic equipment cannot match.
Optimizing Weight Gain
Feed conversion tracking connects directly to weight monitoring. Modern broilers achieve FCR values between 1.3 to 1.5 under optimal conditions (Navfarm, 2020). When weight gains stall but feed intake remains steady, your flock’s feed conversion rate (FCR) deteriorates rapidly.
Environmental factors heavily influence conversion efficiency. Birds experiencing thermal stress consume more feed for body temperature regulation rather than growth (Poultry.care, 2024). This appears in your data as weight plateaus despite normal feed consumption.
Take Action Today
Successful livestock weight monitoring requires both quality equipment and consistent protocols. Whether you choose automated systems or manual weighing, ensure your approach provides accurate, actionable data.
Weight fluctuations tell the story of your flock’s health and your management effectiveness. By mastering the interpretation of these variations, you protect profitability while optimizing bird welfare.
References
Broiler Management Guide (2021). Cobb-Vantress. https://www.cobb-vantress.com/assets/Cobb-Files/2024-Cobb500-Broiler-Guide-EN.pdf
Cobb Breeder Management Guide (2024). Cobb-Vantress. https://www.cobb-vantress.com/
De Jong, I.C., et al. (2014). Wet litter not only induces footpad dermatitis but also reduces overall welfare, technical performance, and carcass yield in broiler chickens. Journal of Applied Poultry Research, 23(1), 51-58. https://www.sciencedirect.com/science/article/pii/S1056617119303617
Freitas, B., et al. (2023). Meta-analysis of coccidiosis effects on broiler performance. Poultry Science. https://www.sciencedirect.com/science/article/pii/S0032579123005400
Navfarm (2020). The Ultimate Guide to FCR. https://www.navfarm.com/blog/fcr-guide/
Poultry.care (2024). FCR in Livestock Farming. https://www.poultry.care/blog/fcr-in-livestock-farming
ProAgri Media (2024). Growth monitoring in poultry. https://www.proagrimedia.com/livestock/growth-monitoring-in-poultry/
Tona, K., et al. (2004). Effects of egg storage time on spread of hatch, chick quality, and chick juvenile growth. Poultry Science, 83(10), 1673-1680. https://www.sciencedirect.com/science/article/pii/S0032579119450116
VAL-CO (2021). Management Minute – Broiler Weight Monitoring. https://www.val-co.com/management-minute-broiler-weight-monitoring/