
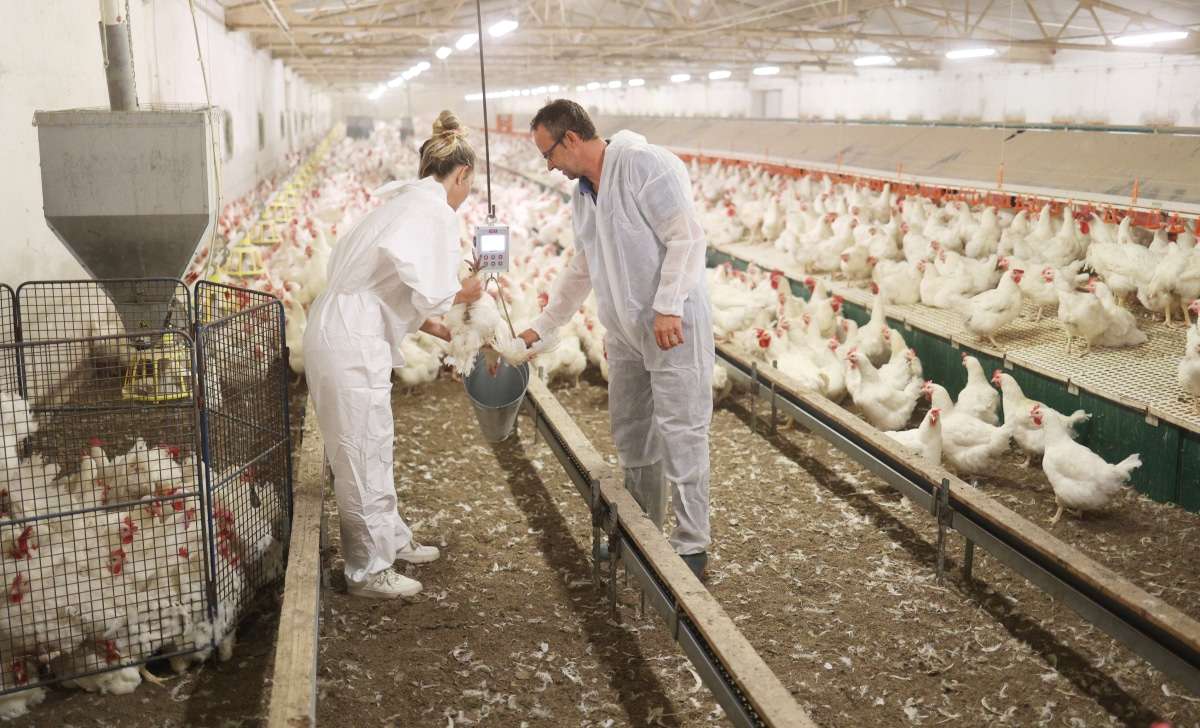
Undetected temperature variation inside a broiler house can erode flock performance long before the problem is visible to the naked eye. While producers routinely monitor average house temperature, localised cold spots often escape attention until their effects are already embedded in the weight data. Understanding how sub-optimal temperatures suppress growth, and how spatial weighing strategies can expose them, gives producers an earlier and more actionable picture of what is happening across their houses.
Why temperature variation in broiler houses matters
Temperature sits at the centre of broiler performance. Even modest deviations from the optimal range produce measurable consequences. Research by Quintana-Ospina et al. (2023) found that broilers exposed to temperatures just 5°C below the optimal range recorded a 50g reduction in body weight by day 21. At that stage of production, a deficit of that magnitude is significant: it represents a departure from expected growth trajectories that, if left unaddressed, compounds through the remainder of the cycle and translates directly into reduced flock value at processing.
The mechanism is straightforward. Birds in cooler zones divert energy toward thermoregulation rather than growth. Feed consumption becomes less efficient, weight gain slows, and uniformity across the flock deteriorates. The result is not just lower average weight but greater variance, which creates further challenges at the processing stage.
How cold spots develop and go undetected
Cold spots within a broiler house are rarely the product of a single, obvious failure. More commonly, they emerge from subtle imbalances in ventilation settings. Drafty conditions caused by inappropriate inlet positioning or incorrect fan staging can produce localised zones of lower temperature that sit well within the broader average reading for the house. A single temperature sensor positioned in the centre of the house will not capture these variations. The average looks acceptable. The birds in the affected area tell a different story.
This is precisely why cold spots can persist across multiple flocks without being identified. There is no alarm, no visible sign of distress, and no single data point that flags the problem. The only consistent signal is the weight data, and only if that data is collected with enough spatial resolution to reveal where in the house underperformance is concentrated.
Using weight data to map thermal performance across the house
Systematic location-based weighing transforms weight records from a flock-level summary into a spatial diagnostic tool. By weighing birds from different areas of the house and recording which location each sample corresponds to, producers can identify sections where birds consistently weigh less than the house average. A pattern of lower weights concentrated in a specific zone is a reliable indicator of an environmental challenge in that area, cold spots being among the most common causes.
The BAT1 manual scale supports this approach directly. Its ability to store data for up to 80 unique locations means that a structured spatial sampling programme can be maintained across the house without additional complexity. Weight records tied to defined locations accumulate over time, making it straightforward to identify whether underperformance in a given zone is a one-off result or a persistent pattern. Integration with BAT Link software allows this location-level data to feed into farm management systems, enabling producers to act on spatial weight trends rather than react to them after the fact.
Targeted adjustments to ventilation settings, inlet positioning, or heating distribution become far easier to make, and far easier to validate, when the weight data is already mapped to specific house locations. The cold spot that previously went undetected for an entire cycle becomes visible within the first weeks of the next one.
Sources
Quintana-Ospina, G.A., Alfaro-Wisaquillo, M.C., Oviedo-Rondon, E.O., Ruiz-Ramirez, J.R., Bernal-Arango, L.C. and Martinez-Bernal, G.D. (2023). Data analytics of broiler growth dynamics and feed conversion ratio of broilers raised to 35 d under commercial tropical conditions. Animals, 13(15), 2447. https://pmc.ncbi.nlm.nih.gov/articles/PMC10416863/