
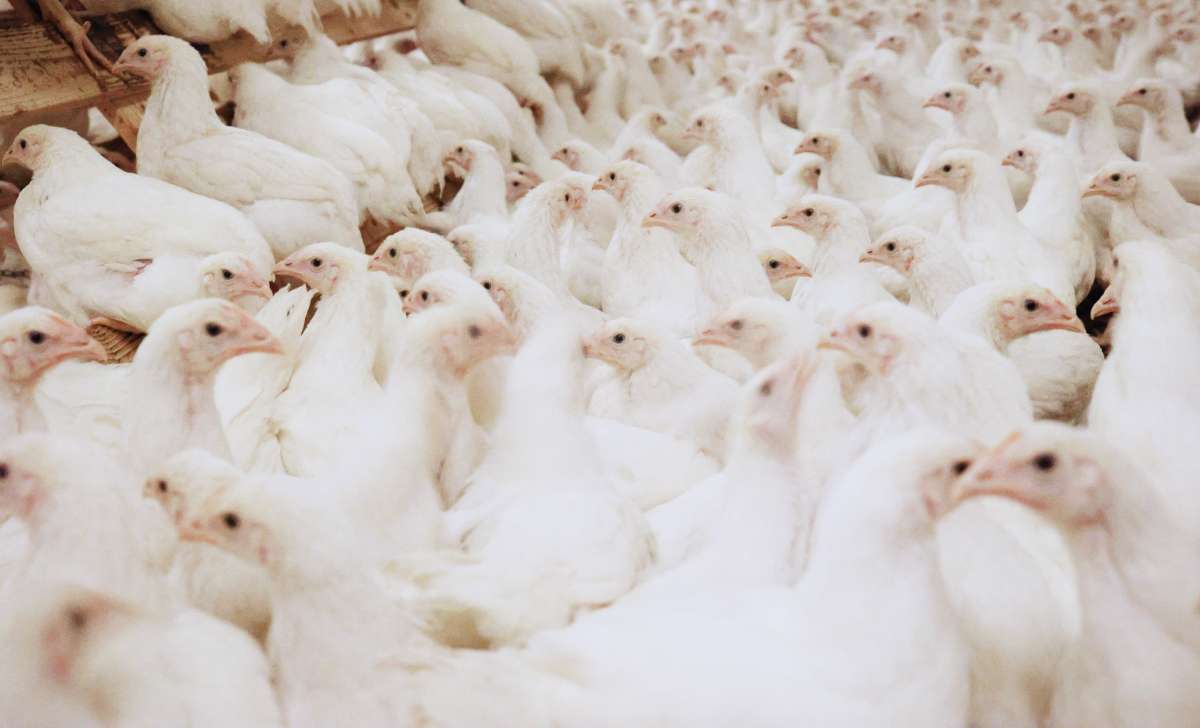
Stocking density in broiler houses is the live weight of birds kept on each square metre of floor, and the right setting is the one where extra output per house outweighs the losses that higher density causes in performance and welfare. EU law caps it at 33 kg/m², and farms that meet added conditions may go as high as 42 kg/m² (Council of the European Union, 2007). In a trial covering 31 to 41.5 kg/m², broilers at the highest density weighed 49 g less at 34 days than those at the lowest and had about three times their incidence of footpad dermatitis at 27 days (Shynkaruk et al., 2023). Microclimate control and measured flock weights, not a fixed number, should set the target.
From kilograms per square metre to birds per house
The law counts weight, not heads. Council Directive 2007/43/EC sets a basic ceiling of 33 kg/m² and lets keepers who meet extra management requirements, including limits on ammonia and carbon dioxide, go up to 39 kg/m². A further increase of up to 3 kg/m² is allowed where more criteria on official inspection results, management practice and mortality are met (Council of the European Union, 2007). One of those criteria is that cumulative daily mortality in at least seven consecutive, subsequently checked flocks from a house stays below 1% plus 0.06% for each day of slaughter age. For a 42-day flock, that line sits at 3.52%.
To count birds, divide the density by the weight you expect at catching. At 39 kg/m² and 2.2 kg per bird, a house holds about 18 birds on each square metre. At 42 kg/m² the same birds give about 19 birds, and at the 33 kg/m² base level about 15. Cobb (2021) advises projecting density from the expected slaughter live weight and reaching it on the day of catching or the day before. It warns that a wrong density can cause scratching, bruising and mortality, and damage litter. It also ties the ceiling to the house: 30 kg/m² for open-sided houses with stir fans, 39 kg/m² for tunnel ventilation with foggers, and 42 kg/m² for tunnel ventilation with evaporative cooling.
Where extra density stops paying
Per square metre, the economics of density favour more birds. Shynkaruk et al. (2023) note that profitability generally rises with density, even though welfare and performance fall. Their own figures show why. The highest density was about a third above the lowest, 41.5 against 31 kg/m², yet weight at 34 days was only 2.3% lower, at 2.080 against 2.129 kg. By simple arithmetic, that works out at about 30% more live weight on each square metre. Feed efficiency tells a similar story. Shynkaruk et al. (2023) note that many studies report better feed conversion at lower density. Yet in their trial, gain to feed over the whole period was 0.671 at 31 kg/m² and 0.672 at 41.5 kg/m², with no significant effect. The crowded birds reached almost the same weight at the same feed efficiency.
The gain does not climb forever. Estevez (2007) concluded that returns per unit of floor space level off at excessive densities, because bird performance declines. Dozier et al. (2005) saw performance depression in heavy male broilers grown for 49 days. Raising density from 30 to 45 kg/m² cut weight gain and feed intake, and more carcasses carried scratches. The authors judged that going above 30 kg/m² had some negative effects on live performance. No universal density figure exists (Shynkaruk et al., 2023). Each grower should test how the chosen hybrid responds to the climate and equipment in the house.
The costs hide behind the averages. In the Shynkaruk trial, litter dry matter fell from 86 to 79% as density rose, and infectious mortality (deaths assigned to infectious causes, such as yolk sac infection or airsacculitis) between 21 and 34 days climbed from 0.23 to 0.81%. Overall mortality and condemnations at the processing plant did not differ significantly, so the costs showed up in litter, feet and growth before they reached the headline totals. Welfare certification adds a second lens, since labelling schemes may bring premiums for lower densities (Shynkaruk et al., 2023).
What crowding does to welfare indicators
Footpad condition and litter move first. At 27 days in the Shynkaruk trial, the share of birds with any footpad lesion was 11.7% at 31 kg/m² and 36.7% at 41.5 kg/m². Fear, measured in a novel object test, was higher too: birds at the highest density took 55 seconds to peck a novel object, against 32 seconds at the lowest. Gait scores did not differ. Stress, measured by the heterophil-to-lymphocyte ratio, was higher at the lowest and highest densities than at the two middle ones, so more space is not automatically better.
Density is not the whole story. Dawkins et al. (2004) concluded that housing conditions affect chicken welfare more than stocking density does. Shynkaruk et al. (2023) took a similar view of environmental management, while still finding poorer welfare at higher density. This is why ventilation capacity deserves as much attention as the density figure itself.
Footpads are judged best with the bird in the hand. Weighing a sample of birds by hand gives that chance, and the weigher can record fleshing scores at the same visit.
Why uniformity does not settle the question
It is tempting to read poor uniformity as a sign of overcrowding. The evidence is less clear. Uniformity is usually expressed as the share of birds within 10% of the mean weight, or as the coefficient of variation (CV). Under standard commercial conditions it reaches about 90% (Choi et al., 2026). When space is tight, dominant birds may hold on to the feeder and smaller birds eat less. Choi et al. (2026) offer this as a hypothesis, not a proven effect. In the studies they review, uniformity was unaffected across 15.2 to 30.4 birds/m² at 28 days, and across 27 to 39 kg/m² at 42 days. Shynkaruk et al. (2023) also found no significant effect from 31 to 41.5 kg/m², with feeder and drinker space equal in every treatment. Lower densities, from 11.9 to 23.8 birds/m², reduced uniformity in the finisher phase, because extra space let fast-growing birds outcompete smaller ones (Choi et al., 2026). The review lists high density among the stressors that can lower uniformity, but also concludes that its effect is not consistent.
Density rarely acts alone. Cobb (2021) states that if feeder space is insufficient, growth slows and uniformity is severely compromised, and that the number of feed lines may vary with stocking density. Choi et al. (2026) add uneven air flow and temperature distribution, and feed form, to the list.
A flock average cannot show any of this. The BAT2 Connect automatic poultry scale records weights as birds step on and reports average weight, CV, uniformity and the difference from the standard growth curve, so a widening spread shows up as the flock grows. These are flock-level figures, so they show the spread but not which birds sit in the tail.
Density is set once, at placement, so the comparison that teaches most is between flocks. BAT Cloud keeps weight data from every house in one place and lets you view it remotely, so weight data across houses and seasons stocked at different densities can be read together.
Thinning and the figures that set the target
Thinning is one way to keep density in a good range. Cobb (2021) describes placing more birds and removing 20 to 50% at a lower target weight, so the remaining birds have more space as they grow heavier. The timing of that removal depends on weight, which makes accurate weighing the key tool.
A short set of figures keeps the decision honest: kilograms and birds per square metre at placement and at catching, live weight produced per square metre, cumulative mortality against the 1% plus 0.06% line, and final weight, uniformity and footpad scores. The Directive already requires house records of birds placed, usable area, deaths and culls at each check, and birds removed, which must be kept for at least three years (Council of the European Union, 2007). The BAT1 manual poultry scale supplies individual weights and the CV from a sample, so the spread is measured before each thinning rather than guessed.
Where a farm also weighs automatically, continuous flock-level weighing shows whether growth is slowing against the curve after density rises. After placement, the weight data show whether the choice of density was right.
References
- Choi, J., Goo, D., Ko, H., Lee, J., & Kim, W. K. (2026). Factors affecting flock uniformity in broiler production: Individual, environmental, and management characteristics. Animals, 16(2), 185. https://www.ncbi.nlm.nih.gov/pmc/articles/PMC12837223/
- Cobb-Vantress. (2021). Broiler management guide. https://www.cobb-vantress.com
- Council of the European Union. (2007). Council Directive 2007/43/EC of 28 June 2007 laying down minimum rules for the protection of chickens kept for meat production. Official Journal of the European Union, L 182. https://eur-lex.europa.eu/eli/dir/2007/43/oj/eng
- Dawkins, M. S., Donnelly, C. A., & Jones, T. A. (2004). Chicken welfare is influenced more by housing conditions than by stocking density. Nature, 427, 342-344. https://users.ox.ac.uk/~abrg/papers/dawkins/Nature.pdf
- Dozier, W. A., III, Thaxton, J. P., Branton, S. L., Morgan, G. W., Miles, D. M., Roush, W. B., Lott, B. D., & Vizzier-Thaxton, Y. (2005). Stocking density effects on growth performance and processing yields of heavy broilers. Poultry Science, 84(8), 1332-1338. https://academic.oup.com/ps/article/84/8/1332/1506532
- Estevez, I. (2007). Density allowances for broilers: Where to set the limits? Poultry Science, 86(6), 1265-1272. https://academic.oup.com/ps/article/86/6/1265/1579944
- Shynkaruk, T., Long, K., LeBlanc, C., & Schwean-Lardner, K. (2023). Impact of stocking density on the welfare and productivity of broiler chickens reared to 34 d of age. Journal of Applied Poultry Research, 32, 100344. https://doaj.org/article/001cce85331b46c6a39c1836996a6ed1