
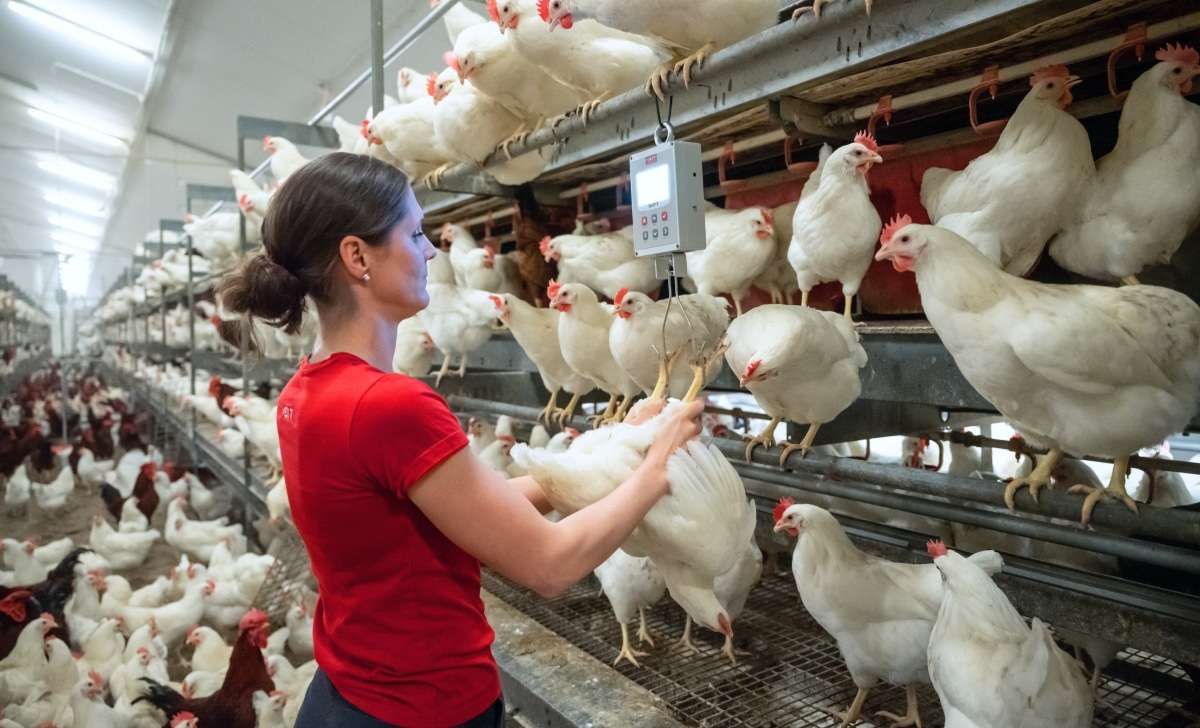
Modern poultry science has established that weight data is one of the earliest and most reliable indicators of disease pressure in a broiler flock. By the time clinical signs become visible, pathogens may already have been suppressing growth for days. Continuous weight monitoring closes that gap.
Weight as a disease indicator
Growth rate and body weight respond to pathogen challenge before outward symptoms develop. Tandoğan and Çiçek (2016) noted that growth rates and body weight serve as sensitive indicators of discomfort in a flock, and that accurate weighing can be used to identify problems well before visible signs appear. This sensitivity makes weight data a practical surveillance tool rather than simply a production metric.
Three early warning patterns are particularly significant: a coefficient of variation (CV) above 10% before day 10, a sudden drop in daily gain, and unexpected changes in uniformity. Any one of these signals warrants immediate investigation.
Key pathogens and their growth impacts
A meta-analysis by Remus et al. (2014) quantified the growth suppression associated with three common poultry pathogens. Clostridium infection was linked to a 40% reduction in growth, Salmonella to a 29% reduction, and E. coli to an 11% reduction. These figures demonstrate that the productive cost of infection is substantial and measurable, and that different pathogens impose different magnitudes of weight impact. Tracking daily gain against expected growth curves gives producers a data-driven basis for distinguishing normal variation from pathogen-driven suppression.
CV and uniformity as early warning metrics
Coefficient of variation and flock uniformity are the statistical expressions of weight distribution across a house. When disease pressure is present, individual birds respond unevenly, and that divergence is captured in rising CV values and declining uniformity before average weight itself shows a clear decline.
Mels et al. (2023) demonstrated that automatic scales provide continuous access to real-time flock development data, allowing immediate response to any deviations from the optimal state. Continuous weighing makes it possible to detect these distributional shifts as they emerge rather than at the next scheduled weigh-in. Comparing current CV and uniformity trends against historical baselines for the same house and flock type sharpens the diagnostic value of the data further.
The practical protocol that follows from this evidence is straightforward: monitor CV and uniformity daily, compare against historical data, and act on deviations without delay. Early detection compresses the window between infection and intervention, reducing both treatment costs and production losses.
Sources
Remus, A., Peres Neto, J. V., Haese, D., Kimura, N. K., & Lazzeri, D. B. (2014). The effect of sanitary and rearing conditions on broiler performance. Poultry Science, 93(5), 1149–1158. https://www.sciencedirect.com/science/article/pii/S0032579119303025
Tandoğan, M., & Çiçek, H. (2016). Effect of live weight and body weight gain on the performance of laying hens. Brazilian Journal of Poultry Science, 18, 169–174. https://www.scielo.br/j/rbca/a/dxLCrdMvvBBBTSYZTdY3HfP/?lang=en
Mels, C., Bergmans, L., Glorieux, S., & Majdeddin, M. (2023). Continuous weighing as a decision support tool in broiler production. Preventive Veterinary Medicine, 217, 105929. https://www.sciencedirect.com/science/article/pii/S0167587723001484